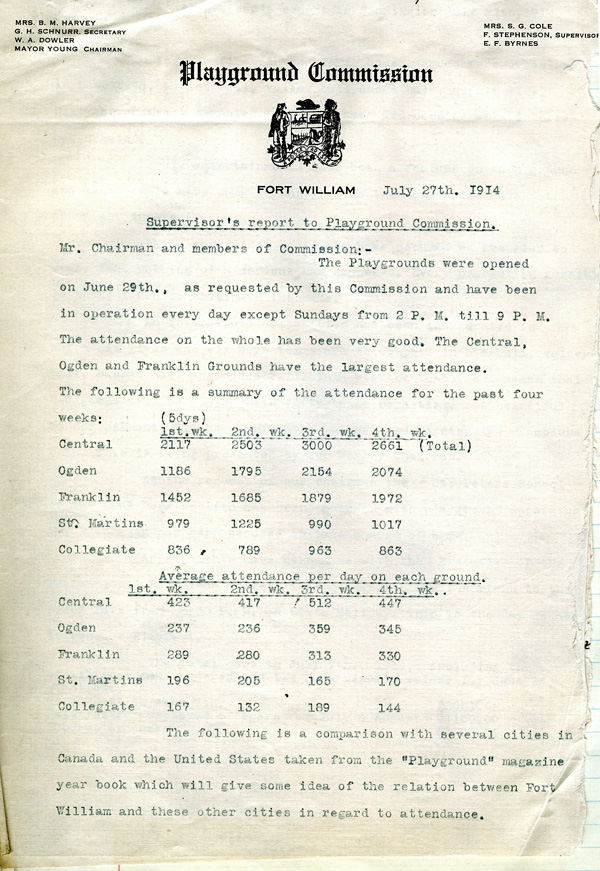
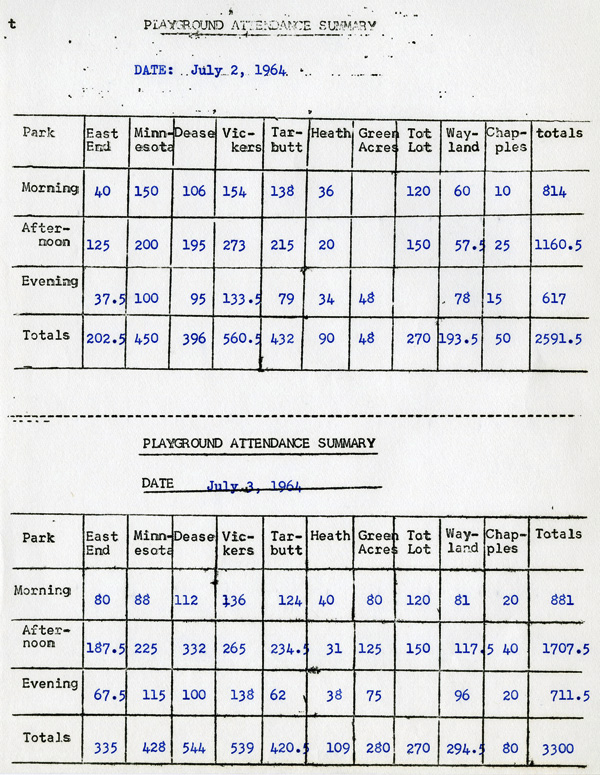
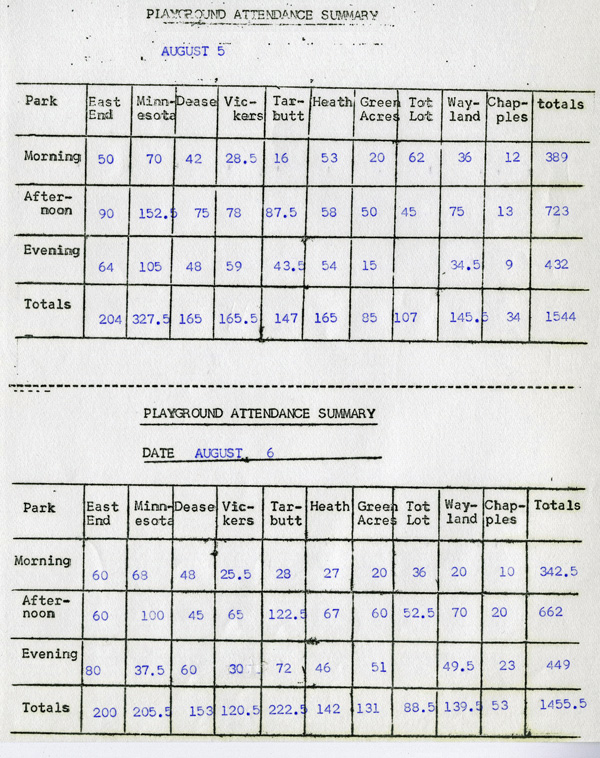
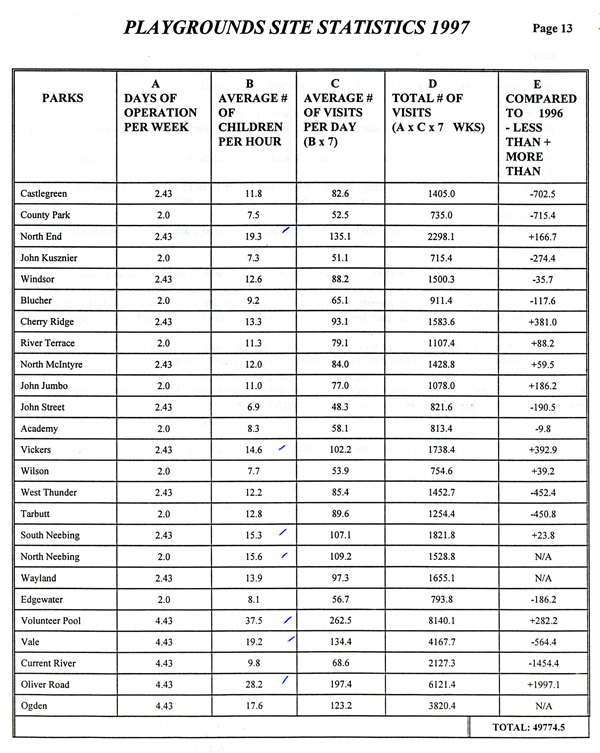
The documents on this page show the Playgrounds organizers' recording of attendance data. The way the information was collected and presented varies significantly between the years -- yet we can still compare the numbers as shown from 1914, 1964, and 1997. The number of operating sites increases dramatically, yet the number of children per site decreases, leading to a relatively stable total playground attendance.
It should also be noted that for each year, the numbers are presented in a way that shows the Playgrounds Program in the best light possible, having very high attendance, rather than in the way that would be most accurate.

[Letterhead:] Playground Commission, Fort William
July 27th, 1914
Supervisor's Report to Playground Commission.
Mr. Chairman and members of Commission:
The Playgrounds were opened on June 29th., as requested by this Commission and have been in operation every day except Sundays from 2 P.M. till 9 P.M. The attendance on the whole has been very good. The Central, Ogden and Franklin Grounds have the largest attendance. The following is a summary of the attendance for the past four weeks: (5 days)
|
Playground |
1st wk. |
2nd wk. |
3rd wk. |
4th wk. |
|---|---|---|---|---|
|
Central |
2117 |
2503 |
3000 |
2661 |
|
Ogden |
1186 |
1795 |
2154 |
2074 |
|
Franklin |
1452 |
1685 |
1879 |
1972 |
|
St. Martins |
979 |
1225 |
990 |
1017 |
|
Collegiate |
836 |
789 |
963 |
863 |
Average attendance per day on each ground.
|
Playground |
1st wk. |
2nd wk. |
3rd wk. |
4th wk. |
|---|---|---|---|---|
|
Central |
423 |
417 |
512 |
447 |
|
Ogden |
237 |
236 |
359 |
345 |
|
Franklin |
289 |
280 |
313 |
330 |
|
St. Martins |
196 |
205 |
165 |
170 |
|
Collegiate |
167 |
132 |
189 |
144 |
The following is a comparison with several cities in Canada and the United States taken from the "Playground" magazine year book which will give some idea of the relation between Fort William and these other cities in regard to attendance.
Title: Supervisor's Report to Playground Commission
Date: July 27, 1914
Creator: [Playgrounds Supervisor]
Series: 5, Fort William Board of Parks Management Minutes
Location: TBA 5572

Playground Attendance Summary
Date: July 2, 1964
Playground Attendance Summary
Date: July 3, 1964

Playground Attendance Summary
Date: August 5
Playground Attendance Summary
Date: August 6
Title: Playground Attendance Summary
Date: July-August 1964
Creator: Fort William Parks and Recreation
Series: 121, Fort William Parks & Recreation Files
Location: TBA 4802-10

Playground Site Statistics 1997
|
Parks |
Days of Operation Per Week |
Average # of Children Per Hour |
Average # of Visits Per Day |
Total # of Visits (7 weeks) |
Compared to 1996 |
|---|---|---|---|---|---|
|
Castlegreen |
2.43 |
11.8 |
82.6 |
1405.0 |
-702.5 |
|
County Park |
2.0 |
7.5 |
52.5 |
735.0 |
-715.4 |
|
North End |
2.43 |
19.3 |
19.3 |
2298.1 |
+166.7 |
|
John Kusznier |
2.0 |
7.3 |
51.1 |
715.4 |
-274.4 |
|
Windsor |
2.43 |
12.6 |
88.2 |
1500.3 |
-35.7 |
|
Blucher |
2.0 |
9.2 |
65.1 |
911.4 |
-117.6 |
|
Cherry Ridge |
2.43 |
13.3 |
93.1 |
1583.6 |
+381.0 |
|
River Terrace |
2.0 |
11.3 |
79.1 |
1107.4 |
+88.2 |
|
North McIntyre |
2.43 |
12.0 |
84.0 |
1428.8 |
+59.5 |
|
John Jumbo |
2.0 |
11.0 |
77.0 |
1078.0 |
+186.2 |
|
John Street |
2.43 |
6.9 |
48.3 |
821.6 |
-190.5 |
|
Academy |
2.0 |
8.3 |
58.1 |
813.4 |
-9.8 |
|
Vickers |
2.43 |
14.6 |
102.2 |
1734.8 |
+392.9 |
|
Wilson |
2.0 |
7,7 |
53.9 |
754.6 |
+39.2 |
|
West Thunder |
2.43 |
12.2 |
85.4 |
1452.7 |
-452.4 |
|
Tarbutt |
2.0 |
12.8 |
89.6 |
1254.4 |
-450.8 |
|
South Neebing |
2.43 |
15.3 |
107.1 |
1821.8 |
+23.8 |
|
North Neebing |
2.0 |
15.6 |
109.2 |
1528.8 |
N/A |
|
Wayland |
2.43 |
13.9 |
97.3 |
1655.1 |
N/A |
|
Edgewater |
2.0 |
8.1 |
56.7 |
793.8 |
-186.2 |
|
Volunteer Pool |
4.43 |
37.5 |
262.5 |
8140.1 |
+282.2 |
|
Vale |
4.43 |
19.2 |
134.4 |
4167.7 |
-564.4 |
|
Current River |
4.43 |
9.8 |
68.6 |
2127.3 |
-1454.4 |
|
Oliver Road |
4.43 |
28.2 |
197.4 |
6121.4 |
+1997.1 |
|
Ogden |
4.43 |
17.6 |
123.2 |
3820.4 |
N/A |
Title: Playgrounds Site Statistics 1997
Date: 1997
Creator: Thunder Bay Parks and Recreation
Series: CS299, Parks and Recreation files
Location: 26-3-1-5
Contact Us


